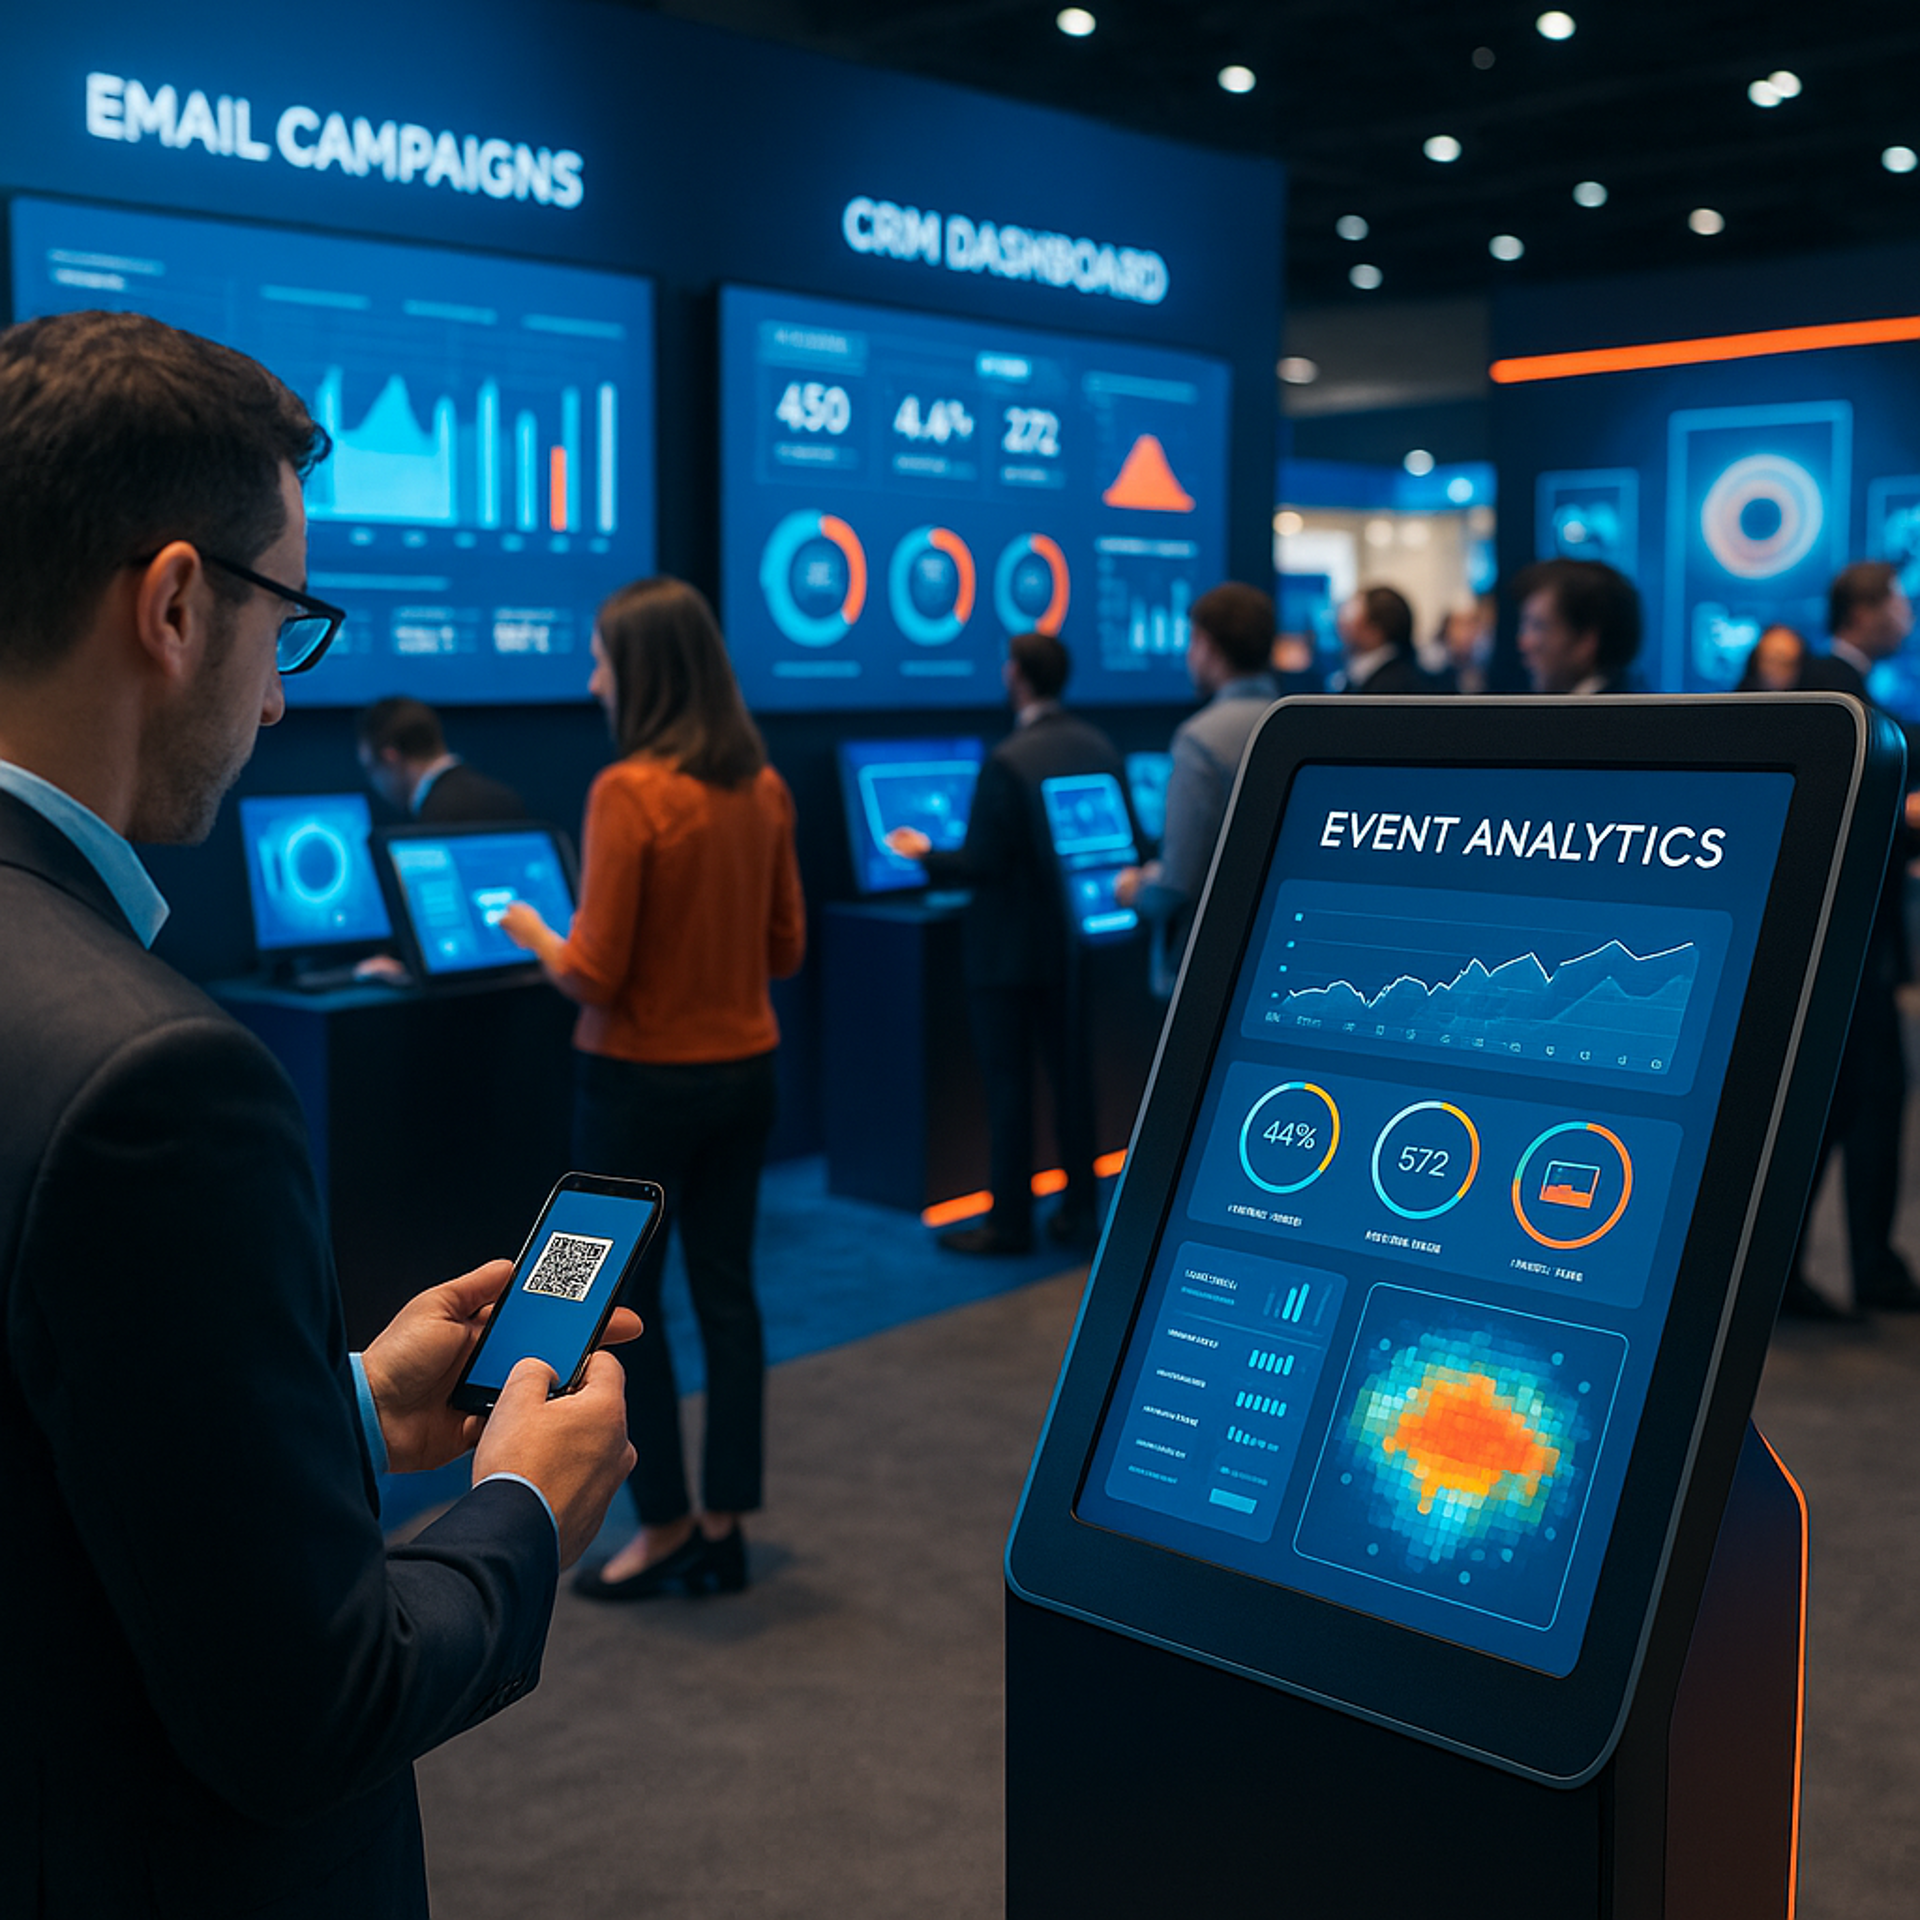
If you only think about ROI after your trade show wraps up, you’re already behind.
The most successful brands plan their ROI strategy the same way they plan their booth—early, intentionally, and with the right tools in place to measure what matters. From the first pre-show email to the last post-show lead follow-up, every phase offers a chance to track real value.
Here’s how to do it.
Before the Show: Track Your Pre-Event Momentum
This is where your ROI story begins—long before your LED wall lights up.
UTM Links & Campaign Tracking
Use custom UTM links for every email, social post, or promo driving attendees to your booth, registration, or landing page.
Tools to use: Google Analytics, HubSpot, Mailchimp, Campaign URL Builder
Email Performance
Track open rates, click rates, and RSVP conversions from your event invites or pre-show drip campaigns.
QR Codes
Include unique QR codes on pre-event mailers, print ads, or social posts—each pointing to a trackable landing page.
Why it matters: When someone shows up at your booth and says “I saw you in that email,” you’ll know exactly which touchpoint worked.
During the Show: Measure Engagement in Real Time
Here’s where your AV setup becomes your smartest data tool.
Foot Traffic + Dwell Time
Use tools like FastSensor or Metrics to track:
- How many attendees visit
- How long they stay
- Where they spend their time in the booth
Interactives + Touchpoints
Log every interaction with:
- Product demos
- Gamified displays
- Digital surveys or quizzes
- Kiosk check-ins or lead forms
Pro tip: Use tagging or source fields in your lead forms to match engagement back to booth areas or campaigns.
Live Demo or Presentation Analytics
If you’re running scheduled sessions:
- Count attendees
- Measure retention over time
- Collect post-session survey data (with QR codes or digital forms)
Why it matters: Real-time data lets you adjust on the fly—or simply validate that the booth is doing its job right now.
After the Show: Connect, Score, and Analyze
Once the show’s over, the ROI story continues.
Lead Scoring and Segmentation
Sort leads based on:
- How they engaged
- What they interacted with
- Any scoring questions you built into your lead capture
Tools to use: HubSpot, Salesforce, Zoho, or your CRM of choice
Post-Show Email Performance
Send tailored follow-ups based on the experience each visitor had. Then track:
- Open and click-through rates
- Meeting or demo conversions
- Replies or new inbound leads
ROI Reporting and Stakeholder Dashboards
Roll it all up into a clean, compelling recap for your stakeholders. Show:
- Leads and engagement by activity
- Cost per lead
- Event-driven pipeline
- Qualitative wins (press coverage, social buzz, partner convos)
Why it matters: A clear, visual ROI report helps you justify spend—and secure more budget next year.
Connect the Dots for a Full ROI Picture
The key is consistency. Use the same campaign tags, lead capture logic, and engagement tracking across platforms so your pre-show promos, in-booth data, and post-show follow-up all tell one unified story.
And if you’re feeling overwhelmed?
That’s where Stamm Media comes in.
We don’t just bring AV—we bring strategy. From interactive tech that tracks real engagement to seamless lead capture tools and analytics support, we help you measure what matters, from start to finish.
